A performance panel for WebGPU, and the numbers it cannot give you
· 3 min read · three.js, react-three-fiber, webgpu, performance, open-source
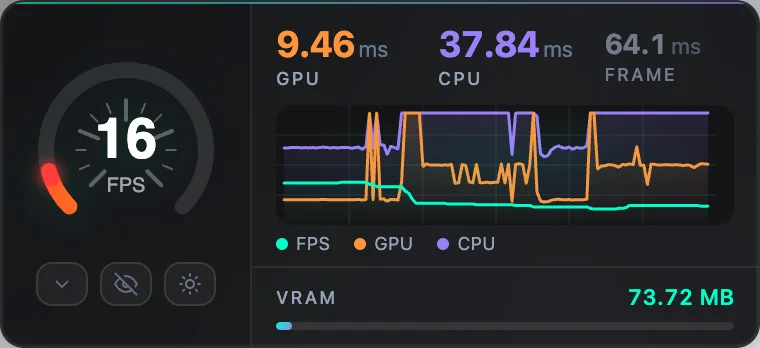
When a scene runs slowly, the first thing you want is a number. How many draw calls, how many triangles, how many milliseconds, how much memory. In a React Three Fiber project that number has been, for years, one <Perf /> component away.
I wrote a new one, r3f-webgpu-perf, built to work with both the WebGPU and the WebGL renderers, including setups where the renderer's info object is not available. It is inspired by r3f-perf, it is MIT licensed and it is on npm. This post explains how it collects each number, because some of them are measurements and some are not, and the panel has to be honest about which.
Using it #
import { Canvas } from "@react-three/fiber";
import { Perf } from "r3f-webgpu-perf";

<Canvas>
  <Perf position="top-left" />
  {/* your scene */}
</Canvas>
The panel has a light and a dark mode so it stays readable over bright or dark scenes, a compact and an expanded view, and a button that shrinks it to a dot in the corner, so it does not cover the thing you are trying to look at. In the expanded view it shows draw calls, triangles, geometries, textures, lines and points.
Where each number comes from #
| Number | How it is collected |
|---|---|
| FPS and frame time | performance.now() between frames |
| Draw calls, triangles, geometries, textures | the renderer's info object when it has one, and a traversal of the scene when it does not |
| VRAM | an estimate, from the size of textures and geometry attributes |
| GPU and CPU time | an estimate |
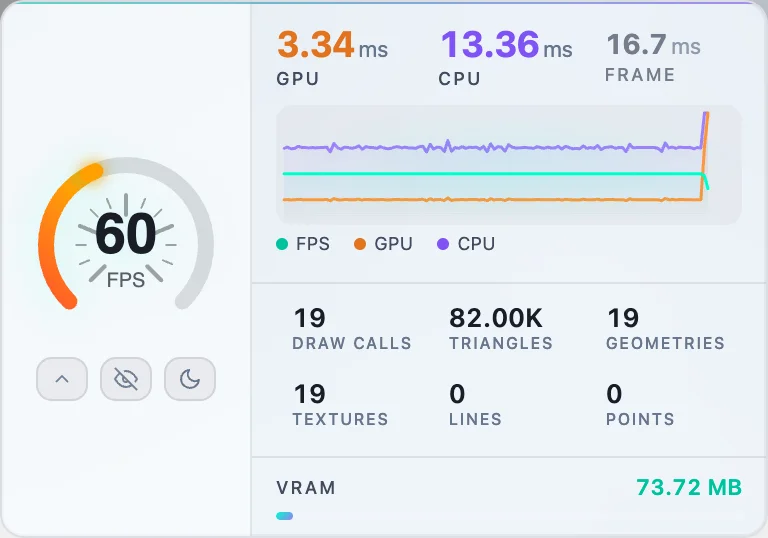
On WebGL, renderer.info is reset before every frame (autoReset is turned off), and read after it, so the numbers describe exactly one frame and not the accumulated total.
On WebGPU, the renderer's info has different fields, and in some setups it is not there at all. When it is missing, the panel walks the scene and counts what it sees: each mesh is a draw call, the triangles come from the index or the position attribute, multiplied by the instance count for instanced meshes, the geometries are counted by unique id, and the textures by the unique texture in the standard material slots.
That fallback is an approximation. It counts what is in the scene, not what was submitted. An object that is culled, or a mesh drawn several times by different passes, will not match what the GPU did. I would use it to compare two versions of the same scene, not to quote a number.
VRAM, estimated #
Texture memory is the width times the height times four bytes, with a multiplier when the texture has mipmaps, and geometry memory is the count times the item size times the bytes per element of each attribute. It leaves out render targets and anything the driver adds, and it counts four bytes for every pixel, so a scene using compressed textures is probably over-reported. Again: good for comparison, not for budgeting.
The part it cannot do yet #
The GPU and CPU numbers are estimates: the panel splits the frame time into 20% for the GPU and 80% for the CPU. They move with the frame time, which is what you need to see a regression, but they are not measured. I want to say that clearly, because a number with a unit looks like a measurement.
Real GPU time on WebGPU comes from timestamp queries, which are not implemented in this package yet. In my own games I use a profiler that does use them, with a time per render pass, and it needs a Chrome flag to enable. The numbers are different in kind: they are what the GPU reports, pass by pass.
Headless mode #
If you want the numbers and not the panel, for a logger or your own UI:
import { PerfHeadless, usePerf } from "r3f-webgpu-perf";

function PerfLogger() {
  const fps = usePerf((s) => s.fps);
  console.log("FPS:", fps);
  return <PerfHeadless logsPerSecond={10} />;
}
PerfPanel is also exported, so you can build your own interface around the same state.
The project page here has a video of the panel.
Related projects
- r3f-webgpu-perf — Performance monitor for React Three Fiber